
Observability: Metrics, Logging and OpenTelemetry
Overview
Observability rests on three pillars, and Membrane API Gateway covers all of them out of the box:
- Metrics: aggregated numbers (request counts, response times, status codes and error conditions) exposed for Prometheus to scrape.
- Logs: per-request messages, tagged with the name of the API that produced them so you can filter by API.
- Traces: the path of a single request across several hops, exported to an OpenTelemetry backend such as Jaeger.
This recipe walks through each pillar step by step using a small demo API. You can adopt them independently or wire up all three at once.
Part 1: Metrics with Prometheus
Membrane continuously collects statistics for every API it serves. The prometheus plugin exposes those statistics in the Prometheus format on a dedicated endpoint. When the plugin runs, it answers the request directly and returns the collected data. So give it its own API, maybe with a separate port, rather than placing it in front of a backend.
Step 1: Configure a demo API and a metrics endpoint
Put the following into your apis.yaml. The demo API is named, because Membrane labels every metric with the API name. Unnamed APIs are harder to tell apart on a dashboard. (And actually Membrane exposes a special metric membrane_duplicate_rule_name to indicate the situation where multiple APIs' statistics are collected on the same name.)
# yaml-language-server: $schema=https://www.membrane-api.io/v7.2.4.json

api:
  name: Orders
  port: 2000
  target:
    url: https://api.predic8.de/shop/v2/

---

api:
  name: Monitoring
  port: 9000
  path:
    uri: /metrics
  flow:
    - prometheus: {}
# yaml-language-server: $schema=https://www.membrane-api.io/v7.2.4.json

api:
  name: Orders
  port: 2000
  target:
    url: https://api.predic8.de/shop/v2/

---

api:
  name: Monitoring
  port: 9000
  path:
    uri: /metrics
  flow:
    - prometheus: {}
Step 2: Generate some traffic
Start Membrane and send a few requests through the demo API so there is something to measure:
curl http://localhost:2000/products
curl http://localhost:2000/products
curl http://localhost:2000/does-not-exist
Step 3: Scrape the metrics
Now read the metrics endpoint:
curl http://localhost:9000/metricsMembrane responds with counters and totals for every API it serves, broken down by HTTP status code. All metric names are prefixed with membrane_ and carry a rule label holding the API name – note that the Monitoring endpoint counts itself as well:
membrane_info{version="7_2_4"} 1
membrane_count{rule="Orders",code="200"} 2
membrane_count{rule="Orders",code="404"} 1
membrane_count{rule="Monitoring",code="200"} 1
# TYPE membrane_good_count counter
membrane_good_count{rule="Orders",code="200"} 2
membrane_good_count{rule="Orders",code="404"} 0
membrane_good_count{rule="Monitoring",code="200"} 1
# TYPE membrane_good_time counter
membrane_good_time{rule="Orders",code="200"} 53
membrane_good_time{rule="Monitoring",code="200"} 0
# TYPE membrane_good_bytes_res_body counter
membrane_good_bytes_res_body{rule="Orders",code="200"} 15840
# TYPE membrane_rule_active gauge
membrane_rule_active{rule="Orders"} 1
membrane_rule_active{rule="Monitoring"} 1
Explanation: membrane_count is the total number of requests, membrane_good_count the ones completed without an error, and membrane_good_time their accumulated processing time in milliseconds; membrane_rule_active reports whether each API is currently up. Because every series is labeled with rule="...", a single Membrane instance serving many APIs produces clean, per-API time series. Membrane also exposes response-time histograms (membrane_<metric>_bucket), TLS certificate validity, OpenAPI validation counts, and load-balancer node health.
Step 4: Point Prometheus at Membrane
Add Membrane as a scrape target in your prometheus.yml:
scrape_configs:
  - job_name: membrane
    metrics_path: /metrics
    static_configs:
      - targets: ['localhost:9000']
scrape_configs:
  - job_name: membrane
    metrics_path: /metrics
    static_configs:
      - targets: ['localhost:9000']
From here, Prometheus stores the time series and a tool such as Grafana can chart request rates, error ratios, and latency percentiles per API. A runnable Docker Compose demo including ready-made Grafana dashboards is available in the prometheus-grafana example.
Part 2: Per-API Logging with the MDC Context
When one gateway serves dozens of APIs, a flat log stream is hard to read. Membrane can tag every log line with the name of the API that produced it, so you can grep, filter, or route logs per API. It does this through the logging context (the SLF4J/Log4j2 MDC – Mapped Diagnostic Context), a set of key/value pairs attached to the current request thread.
Step 1: Enable the logging context
The logContext plugin (active by default) writes the current API's name into the MDC under the key api at the start of each request and removes it again when the request finishes.
Step 2: Read the API name in your logs
Membrane's default Log4j2 configuration prints the whole MDC map with the %X pattern. Once logContext is active, every log line emitted while handling a request carries the API name in curly braces:
17:01:27,800 INFO 66 router LogInterceptor:178 {api=Orders} - ============ Request: Orders ============The {api=Orders} fragment comes straight from the MDC. Logging plugins like log that you place inside an API, as well as any other API-specific log message, therefore produce messages that are already attributed to that API.
Step 3 (optional): Give the API name its own column
If you prefer the API name as a dedicated field rather than as part of the full MDC dump, reference the api key explicitly with %X{api} in your log4j2.xml pattern (this file is Log4j2's own configuration, so it stays XML):
<PatternLayout pattern="%d{ABSOLUTE} %5p %c{1}:%L [api=%X{api}] - %m%n"/>
<PatternLayout pattern="%d{ABSOLUTE} %5p %c{1}:%L [api=%X{api}] - %m%n"/>
This is also the mechanism behind Membrane's structured accessLog, where each additionalVariable binds a name that you reference in log4j2.xml as %X{name}.
Part 3: Distributed Tracing with OpenTelemetry
Metrics and logs describe a single gateway; OpenTelemetry tracing follows one request across several hops. The openTelemetry plugin opens a span for every request passing through, reads any incoming W3C trace context, and injects an updated traceparent header into the forwarded request, so downstream services join the same trace. It records HTTP headers, the response status, and (for API proxies) the OpenAPI title on the span, and writes the traceId and spanId into the MDC so your logs line up with your traces.
Step 1: Start an OpenTelemetry backend (Jaeger)
Any OTLP-compatible collector works. Jaeger is the quickest to run locally:
docker run -it --name jaeger \
  -e COLLECTOR_OTLP_ENABLED=true \
  -p 16686:16686 -p 4317:4317 -p 4318:4318 \
  jaegertracing/all-in-one:latest
Port 16686 serves the Jaeger UI; 4317 is the OTLP gRPC endpoint Membrane exports to.
Step 2: Register the exporter globally
Declaring openTelemetry under global instruments every API at once. sampleRate: 1.0 traces 100% of requests, which is ideal for a demo; lower it in production.
# yaml-language-server: $schema=https://www.membrane-api.io/v7.2.4.json

global:
  - openTelemetry:
      sampleRate: 1.0
      otlpExporter:
        host: localhost
        port: 4317
        transport: grpc
# yaml-language-server: $schema=https://www.membrane-api.io/v7.2.4.json

global:
  - openTelemetry:
      sampleRate: 1.0
      otlpExporter:
        host: localhost
        port: 4317
        transport: grpc
Step 3: Send a request and inspect the trace
Route a request through a chain of APIs and open the Jaeger UI at http://localhost:16686. Each hop appears as a span, and the spans nest into a single end-to-end trace:
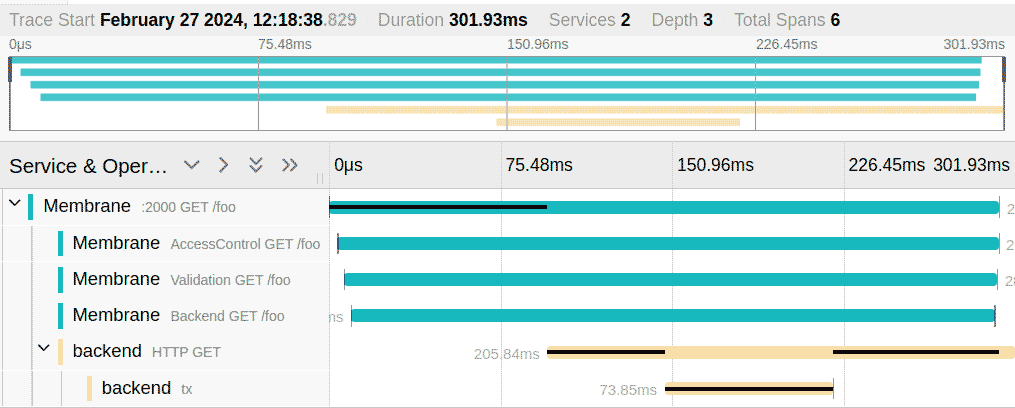
A request through several Membrane APIs, visualized as nested spans in the Jaeger UI.
Because the traceId is also in the MDC, you can add it to your log pattern (%X{traceId}/%X{spanId}) and jump from a log line straight to the matching trace in Jaeger.
Detailed setup
For a complete, runnable multi-hop configuration, including the apis.yaml, the log4j2.xml that correlates logs with traces, and a walkthrough, see the OpenTelemetry example in the Membrane distribution and the openTelemetry reference.
Resources
| prometheus | Example | Documentation |
| logContext | Color logging | accessLog reference |
| openTelemetry | Example | Documentation |